About

Thermography

What is Thermography?


As used here, Thermography is defined as: The use of technology to display or "see" part of the electromagnet spectrum that is not visible to the human eye. By sensing infrared radiation emitting from an object, converting it and displaying it in the visible light spectrum, it is possible to produce images which measure and display the temperature range within the image.

Visible Light


Note the ripple effect of the shadows from the visible light (VL) of the ceiling fixture.

Infrared Light


The IR image of the quartz light as captured by the camera is shown here. The temperatures in the image correspond to the colors on the scale on the right side of the picture. The camera software can isolate spots areas, averages and lines for analysis:

The Entire Image 

•Min: 26.6 ℃ 

•Max: 71.1 ℃ 

•Ave: 32.9 ℃

The Spot Measurement Tool 

Sp1 temperature is: 

•69.4℃

The Area Measurement Tool 

Ar1 temperatures are: 

•Minimum: 31.6 ℃ 

•Maximum: 71.1 ℃ 

•Ave: 46.7 ℃


Why use our Thermogram Services?


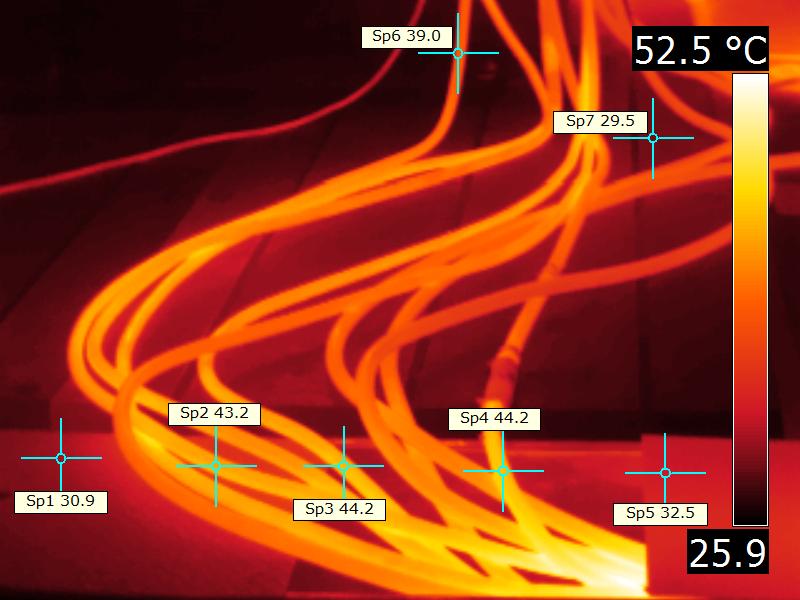
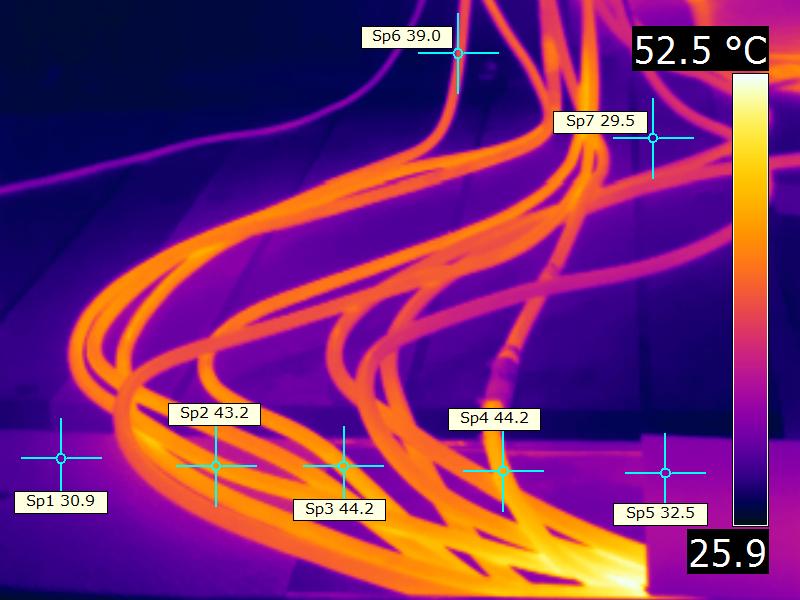
A thermal image or thermogram is a picture of infrared radiation that displays an image by indicating different temperatures. By observing radiation outside the visible light range we are able to “see” temperature differences and to draw various conclusions.


This image can be used for many things including “seeing” an overheated bearing or electrical connection.  It can also “see” not so obvious things, such as sediment in a pipe. It does not actually see the sediment through the pipe (it is not an x-ray) but it sees a difference in the temperature that appears on the image and the viewer may infer that the sediment is there.


Using a thermal camera properly is dependent on setting it up correctly, understanding the environment of the scene, being able to interpret the image properly, and avoiding false conclusions. This requires some understanding of the science, the camera and the objects to be examined.

Our Camera Sensitivity & Accuracy 


This IR picture of our little fox terrier shows his thermal reflection in green on the wooden floor. Note the Spot temperatures. This gives an Idea of the sensitivity and accuracy of the camera.

  • Glowbow.jpg
  • Grey.jpg
  • Greyred.jpg
  • Inverted Grey.jpg
  • Iron Hi.jpg
  • Medical.jpg
  • Rain Hi.jpg
  • Yellow.jpg

Interpreting IR Color Palettes 


Note that the spot temperatures are the same in each of these thermal images although the images look entirely different. Use these images according to the scale on the side and not because one image “looks” hotter or colder than another. Look at the gradients.